
Monitoring of Insect Species Richness and Abundance in Sudan Semi-arid Ecosystem (Case study: Khartoum State/Sudan)
Abstract
Sudan's ecological landscape is characterized by various zones, including deserts, semi-deserts, and savannas, which host a diverse array of forests, rangelands, and numerous plant and animal species. However, the sustainable management of these resources is becoming increasingly challenging due to human activities and the impacts of climate change. This article presents the results of a research project focused on monitoring and documenting biodiversity in Sudan's semi-arid regions, particularly emphasizing insect diversity. Insects are vital for maintaining ecosystem health through processes such as nutrient cycling, decomposition, pollination, and acting as natural predators to pests. Field surveys were conducted across three Sudanese states—North Kordofan, Gezira, and Khartoum—to assess the diversity of flora and fauna. Specifically, El Rawakeeb semi-arid land in Khartoum state was investigated, which comprised three sites with varying soil elevations: a hilly site at 420 meters above sea level, a flat site at 416 meters, and a valley site at 411 meters. Researchers utilized direct collection methods and butterfly nets to gather insect specimens, which were subsequently preserved and identified for further analysis. Diversity indices, including Simpson’s Diversity Index, Shannon-Wiener Index, and Margalef Richness Index, were computed to compare the biodiversity of these sites, along with metrics for evenness and species richness. Permanova analysis was carried out for insect variation between the study sites. A total of 1541 insect specimens were gathered from El Rawakeeb, encompassing 34 species distributed across 21 families and 9 orders. The order Lepidoptera exhibited the greatest number of species (35.29%), followed by Coleoptera (20.59%). The orders Neuroptera, Orthoptera and Thysanoptera recorded the fewest species (2.94% each). From the hilly site, 514 insect specimens were collected, representing 9 orders, among which Hymenoptera included 4 species, while Lepidoptera had 3 species, and Odonata, Orthoptera, and Thysanoptera each had 1 species. The highest individual counts were recorded for Copriniklobe (dung beetle), Dacus longistylus (fruit fly), Camponotussp. (carpenter ant), and Anax ephippiger (dragonfly). In a flat site, 484 insect specimens were collected, classified into 15 species, 12 families, and 7 orders. The highest individual counts were noted in four species: Onthophagusnuba (dung beetle), Dacus longistylus (fruit fly), Camponotussp. (carpenter ant), and Anax ephippiger (dragonfly). In a valley site, 543 insect specimens were collected, categorized into 17 species, 16 families, and 9 orders. Insect Diversity in three research sites. Simpson's Diversity Index revealed varying levels of insect diversity across the three sites. The valley site exhibited the highest diversity level with an index score of 0.857, followed by the flat site at 0.826, and the hilly site at 0.819. The Shannon diversity index of 2.22 indicated the highest diversity among the three sites, suggesting a relatively diverse insect community. The relative abundance of insects was greatest in the valley site at 35.24%, followed by the hilly site at 33.35%, and the flat site at 31.41%. The Margalef Richness Index indicated a moderate level of richness in the insects collected from the three locations. Certain insect species were found in some sites but were absent in others. The PERMANOVA revealed notable variations among the three study sites (F = 2.24, p-value = 0.035).
Article Information
- Received
- Accepted
- Published
Copyright © 2025 Maha A. Abdelatif, et al
 This is an open-access article distributed under the terms of the Creative Commons Attribution License, which permits unrestricted use, distribution, and reproduction in any medium, provided the original author and source are credited.
Corresponding author: Maha A. Abdellatif, Environment and Natural Resources and Desertification Research Institute National, Center, for Research/Khartoum/Sudan —
Competing Interests
The authors have declared that no competing interests exist.
Funding
This study received financial support from the Ministry of Higher Education and Scientific Research in Sudan. In 2021, an amount of 5000 SDG was allocated to facilitate transportation to the research sites, lodging, technician compensation, and the identification of samples at the National Insect Collection Museum of the Agricultural Research Corporation (ARC) located in Wad Medani, Sudan.
Data Availability
The authors affirm that the data underpinning the conclusions of this study can be found within the article and its supplementary materials.
Acknowledgements
Authors are thankful to Mr. Mohamed Elfatih Khalil Ali for conducting PERMANOVA data analysis
Citation:
Introduction
Insects are the most numerous group of animals, found in almost all terrestrial and aquatic ecosystems, and performing important functions like pollination, decomposition, and being a food source for others. Their success stems from characteristics like being small, the capacity for flight, quick reproduction cycles, and mutual adaptation with other organisms (refer to Figure 1, 1). Insects are now decreasing because of changes in the weather and actions by humans that cause them less space, such as pollution. Plant diversity and density significantly contribute to sustenance and protection. Insects grow, reproduce, and develop more rapidly when temperatures and humidity levels are higher, 2. Historically, scientists have relied on experts in taxonomy to classify and count species, which requires extensive knowledge, resources, and specialized skills 3. Conservation experts must decide when essential supplies are missing because they don't have enough data. The urgent requirement for quick and efficient inventory techniques arises due to the significant decrease in species diversity. These tools must be adaptable to diverse settings, especially when initial data is scarce. Insects' diversity can be accurately studied only if we avoid collecting them in ways that favor certain types of insects. Insects' diversity has been studied in Sudan to understand their importance and improve scientists' ability to collect them. Recent studies focus on recording wildlife and protecting habitats, alongside assessing the economic importance of local species. In addition, some research has shown that local communities' traditional wisdom helps people understand their environment better through informal meetings and conversations 4. Several Sudanese universities and research centers joined forces by aligning their projects with the UN's SDGs, focusing specifically on biodiversity use within Sudan's semi-arid region. The National Centre of Research (NCR) leads an initiative with the Agricultural Research Corporation (ARC) and universities, aiming to support UN SDGs in semi-arid areas through research.
Figure 1. The Role of Insects in Ecosystem (Source: Mansowr ZF, 2025)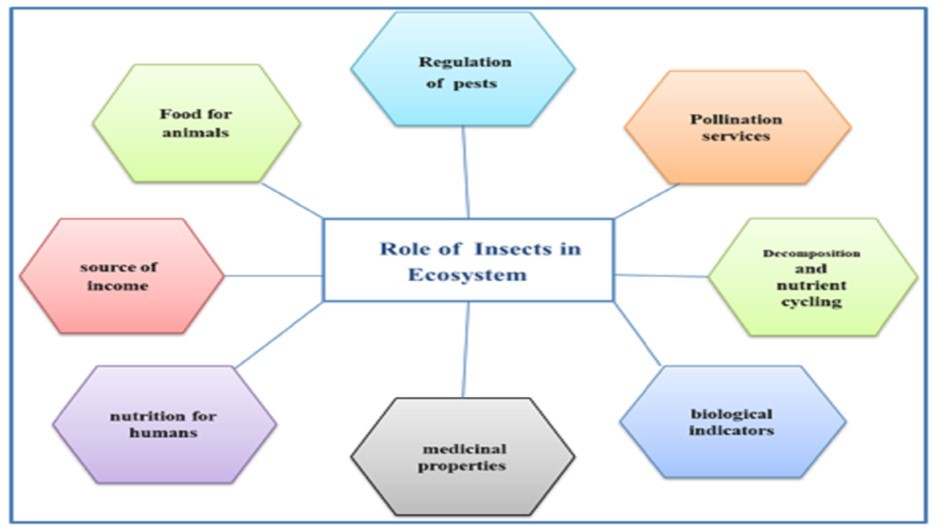
Download figure
Effective monitoring of species populations, assessing ecosystem health, and gauging climate change impacts through established biodiversity monitoring systems is vital for guiding conservation actions, shaping adaptive strategies, and influencing policy decisions. For this purpose, the current study intends to track insect variety within Sudan's semi-arid region, concentrating on North Kordofan, Gezira, and Khartoum provinces. Insect diversity is studied by monitoring species numbers, distribution, and habitat conditions across semi-arid regions. Climate variables affecting insects, like temperature and elevation, were also examined for their impact on biodiversity. The study aimed to create a repository for insects, their roles within ecosystems, how they can be used as indicators of environmental health, and suggestions for both in-place and out-of-place preservation methods.
Materials and Methods
Study area
El Rawakeeb is (15˚-2´ and 15˚-36- N. and longitudes 32˚-0´ and 32-10´ E), lies within the tropical semi-arid region of the Sudan, and its climate is characterized by a short rainy season (July- October) with a peak in August (Figure 1). According to Abdellatif and El Hag (2015), the average rainfall is 100-180 mm and the evaporation potential is 1800 mm, and thus the relative humidity is low. The summer season usually extends for a long period with a maximum temperature of 43.0ºC during May and 43.0ºC during May. The soil temperature is lower than the ambient temperature throughout the year. The geological formation of the area is mainly basement complex overlain by superficial deposits of the Nubian Sandstone. The soil is generally characterized by sandy texture, poor organic nitrogen and carbon, moderate bicarbonate and potassium and high sodium, calcium and chloride contents. The natural vegetation of El Rawakeeb area is composed mainly of Acacia spp. (e.g.Vachellia tortilis) and different grasses (e.g.Aristida spp.). This natural vegetation is replaced in the cultivated sites by some cereals, e.g., Sorghum bicolor and few legumes, e.g.Cajanus cajan. The system of land use is mainly pastoral except in low land where traditional agriculture is practiced.
Three study sites were selected within the study area according to soil elevation and kept as permanent sampling sites. These sites are:
a. Hilly Site: The altitude of this location reaches up to 420 meters above sea level. This site is characterized by sandy loam soil and is interspersed with indigenous vegetation, such as Acacia spp. The average temperatures observed were 32.3°C for the air and 31.3°C for the soil.
b. Flat Site: It stands at an elevation of 416 meters above sea level. The area is defined by sandy clay loam soil, which primarily supports the Acacia species. The average temperatures recorded are 32.0°C for the air and 28.0°C for the soil.
c. Valley Site: This location is defined by a low elevation of 411 meters above sea level. It features sandy soil and supports a variety of Boraginaceae family trees e.g. Cordia sp. The typical air and soil temperatures are 32.2°C and 28.2°C, respectively.
Methods
Insect Pest Collection and Preservation
Direct collection method
Direct collection method described by Diabatéand Tano (2020) who used to collect insect specimens using forceps from plants and soil.
Butterfly netting method
This method was given by Satti and Bilal, (2012), and used to collect aerial insects feeding or resting on the top of crop parts. The butterfly nets are fixed to a strong metal circular frame with a diameter of 38 cm and the frame is connected to an iron stand with a length of 40cm.
Insect preservation
According to Abdalla et al. (2014), insects obtained by the two collection methods mentioned were grouped according to their body thickness. Tiny insect specimens were preserved in 70% ethyl alcohol whereas hard ones were introduced into killing jars and were then kept in insect box for further identification
Statistical Analysis
Data obtained from the three study sites were statistically analyzed using the PERMANOVA, or permutational multivariate analysis of variance, which is a non-parametric statistical method used to determine if groups of objects are significantly different from each other based on multivariate data. Also, variations in insect populations gathered from three study sites, adhering to the methodology set forth by Ghani and Maalik (2020). The analysis encompasses several essential parameters: The Shannon-Wiener index, evenness index, Simpson index, Margalef index, and dominance index. The specifics are detailed below:
a. Simpson’s diversity index
Simpson's Diversity Index (SDI) serves as a metric for assessing diversity. In the field of ecology, it is frequently employed to evaluate the biodiversity within a given habitat. This index considers both the variety of species present and the population size of each species. The calculation is performed using the following formula:
D = 1- (Σn (ni-1)
N (N-1)
Where:
n: The number of organisms that belongs to species.
N: The total number of organisms.
The value of D ranges between 0 and 1. With this index, 1 represents infinite diversity and 0, no diversity, i.e. high D scores indicates high diversity.
b. Shannon-Wiener Diversity Index (H)
The Shannon-Wiener Diversity Index (H) functions as an ecological metric for diversity, taking into consideration both the richness of species and their abundance within an ecosystem. The formula for calculating H is as follows:
H = -Σ (pi * ln(pi)), where 'H' is the Shannon diversity index, 'pi' is the proportion of individuals belonging to the ith species, and 'ln' is the natural logarithm.
c. Dominance Index %
D = 1 - Σ(pᵢ²)
Where:
D = Simpson's Dominance Index
pᵢ = proportion of each species (number of individuals of species i / total number of individuals)
Σ = summation of all species
d. Margalef Index
The Margalef index is employed to evaluate species richness within an ecosystem, calculated using the following formula.:
D = (S - 1) / ln(N),
where,
S = number of species
N = total number of individuals in the sample.
e. Evenness Index
The evenness index measures the relative abundance of various species, reflecting the balance of distribution among different species. It can be determined using this equation:
J = H / ln(S)
Where:
J = Evenness index
H = Shannon-Wiener index
S = Number of species ln= natural logarithm
f. Richness (number of species)
The species richness is determined by counting the total number of species
Identification of Insect Specimens
The insect specimens that were gathered were categorized into the most precise taxonomic groups by the National Insect Collection Museum, the Agricultural Research Corporation (ARC), Wad Medani, Sudan.
Results and Discussion
Insect species composition
Insects collected from the El Rawakeeb region of Khartoum state in 2022 were classified into 34 species, 21 families, and 9 orders, as shown in Table 1. The insect species belonging to the order Lepidoptera account for a notable 35.29% of all species observed, followed by the order Coleoptera at 20.59%. The lowest number of species was recorded from Neuroptera, Orthoptera, and Thysanoptera, each representing 2.94%. This form of dominance could be attributed to habitat diversity, which promotes the proliferation of insects. Dianzinga et al. (2020) discovered that the quantity of habitat had the most significant influence on diversity. However, the impact of habitat quantity on diversity was mitigated in regions characterized by low habitat (or land cover) diversity. Main conclusions: Generalizing the factors that contribute to the elevation diversity gradient has emerged as a fundamental aspect of ecological theory, as it aids in comprehending the effects of human activities on diversity. In this study, we demonstrate that considering landscape information may assist in achieving this goal, as landscape effects often vary with elevation, leading to complex implications for diversity.
Table 1. Taxonomic list of insects collected from Khartoum State 2022| Order | Family | Scientific name | Source of checking name | %Species /Order |
|---|---|---|---|---|
| Coleoptera | Tenebrionidae | VietasenegalensisdongolensisLaporte de Castelnau, 1840 | Zookeys, 2025 | 20.59 |
| Carabidae | Graphipterusobsoletus (Olivier, 1795) | Wikimedia, 2025 | ||
| Scarabaeidae | CatharsiussesostrisWaterhouse, 1888 | GBIF, 2025 | ||
| OnthophagusnubaD'Orbingy, 1902 | EPPO, 2025 | |||
| Copriniklobe, 1805 | ||||
| Diptera | Muscidae | MuscadomesticaL . 1758 | GBIF, 2025 | 5.88 |
| Tephritidae | DacuslongistylusWiedmann, 1830 | EPPO, 2025 | ||
| Hemiptera | Aphididae | Aphidsp. | 8.83 | |
| Lygaeidae | Spilostethussp. | |||
| Pentatomidae | Chlorochroa sp. | |||
| Hymenoptera | Apidae | Xylocopa sp. | 14.71 | |
| Apismellifera L. 1758 | GBIF, 2025 | |||
| Formicidae | Camponotussp . | |||
| Scoliidae | Campsomeriellathoracica (Fabricius, 1778) | Plazi, 2025 | ||
| Megachilidae | Megachilesp. | |||
| Lepidoptera | Papilionidae | Papiliosp. | 35.29 | |
| Colotissp . | ||||
| Pieridae | Catopsiliaflorella (Fabricius, 1775) | GBIF, 2025 | ||
| Belenoisaurota(Fabricius,) | Wikipedia, 2025 | |||
| ColotisephyiaKlug, 1829 | EPPO, 2025 | |||
| Noctuidae | Unidentified | |||
| Spodopterasp. | ||||
| Erebidae | UtetheisapulchellaL. 1758 | GBIF, 2025 | ||
| Neuroptera | Myrmeleontidae | Gymnocnemiasp . | 2.94 | |
| Odonata | Aeshnidae | AnaxephippigerBurmeister, 1830 | Wikimedia, 2025 | 5.88 |
| Ibellulidae | PantalaflavescensFabricius, 1798 | GBIF, 2025 | ||
| Orthoptera | Acrididae | Chrotogonusspp. | 2.94 | |
| Thysanoptera | Thripidae | Thripsp. | 2.94 | |
| 9 | 21 | 34 | 100 |
Insect dominance at El Rawakeeb area in order level
In the year 2022, a total of 1541 specimens were gathered from El Rawakeeb area, which corresponds to 9 different orders (see Table 2). The orders Diptera, Hymenoptera and Coleoptera exhibited the highest percentages among all collected orders, with values of 22.58%, 22.32%, and 21.58%, respectively. Studies indicated insect order abundance varies greatly depending on location, habitat, and collection method. Other studies show different results, with some indicating Hymenoptera, Lepidoptera, or other orders as dominant. Aina-oduntan et al. (2021) conducted a study on the spatial distribution of insect diversity in Nigeria. They concluded that habitat composition influences the diversity and abundance of various insect orders. Thysanoptera and Neuroptera demonstrated the lowest abundance among the total orders collected, with values of 0.58% and 1.04% respectively. Lab et al. (2024) conducted a study on the relative abundance and diversity of insect fauna in India. Their findings emphasized that accurate documentation of insects is essential for understanding biodiversity and population dynamics. Considering the resilience exhibited by most insect species, effective sampling requires the implementation of appropriate strategies for capturing specific insects. They noted the collection of a limited number of Thysanoptera, attributing this to the sampling technique and the availability of host plants, as this order primarily relies on plant hosts.
Table 2. Abundance of insect orders collected from El Rawakeeb area in 2022| Order | Number | % | |
| Coleoptera | 331 | 21.48 | |
| Diptera | 348 | 22.58 | |
| Hemiptera | 73 | 4.74 | |
| Hymenoptera | 344 | 22.32 | |
| Lepidoptera | 82 | 5.32 | |
| Neuroptera | 16 | 1.04 | |
| Odonata | 300 | 19.47 | |
| Orthoptera | 38 | 2.47 | |
| Thysanoptera | 9 | 0.58 | |
| Total | 9 | 1541 | 100% |
Thysanoptera and Neuroptera were found to have the lowest abundance among the total collected orders, with respective percentages of 0.58% and 1.04%. Lab et al. (2024) explored the relative abundance and diversity of insect fauna in India. They demonstrated that precise documentation of insects is vital for the study of biodiversity and population dynamics. In light of the resilience of the majority of insect species, effective sampling necessitates the application of appropriate strategies for capturing specific insects. They reported a limited collection of Thysanoptera, attributing this to the sampling technique and the availability of host plants, as this order is primarily associated with plant hosts.
Insect abundance in the three sites
Hilly site
A total of 514 insect specimens were gathered from the hilly location, representing 9 orders (see Table 3). The most abundant orders are Diptera (flies), Hymenoptera (ants, bees, and wasps), and Coleoptera (beetles), comprising 22.96%, 21.98%, and 20.23% respectively. Tuhin et al. (2023) conducted a study on the relative abundance and diversity of insects in Bangladesh. Their results revealed that Diptera and Hymenoptera were recognized as the most prevalent insect orders. They attributed these findings to seasonal variations as well as ecological and environmental factors that positively influenced the life cycle and feeding habits of insects. Thysanoptera and Orthoptera have the least relative abundance of 0.97 and 2.53 % respectively. Thysanoptera (Thrip) and Orthoptera (grasshoppers, crickets, katydids) exhibit a lower relative abundance on hills mainly due to the presence of less suitable habitats. These include increased shade and humidity found in forested regions, diminished ground cover and food availability on bare slopes, as well as heightened aridity and temperature variations on steep, exposed hillsides that do not provide a conducive environment for these insects. The particular factors contributing to their low abundance differ between the two orders. Orthoptera are frequently sensitive to insufficient food supply and an inadequate microclimate, whereas Thysanoptera, which are characterized by high host specificity, depend on particular host plants and conditions that are not consistently available in hilly terrains 4.
Table 3. Insect relative abundance (%) in the hilly site| Order | Individual number | Relative abundance (%) |
|---|---|---|
| Coleoptera | 104 | 20.23 |
| Diptera | 118 | 22.96 |
| Hemiptera | 31 | 6.03 |
| Hymenoptera | 113 | 21.98 |
| Lepidoptera | 22 | 4.28 |
| Neuroptera | 8 | 1.56 |
| Odonata | 100 | 19.46 |
| Orthoptera | 13 | 2.53 |
| Thysanoptera | 5 | 0.97 |
| Total | 514 | 100 |
Species composition and ecological role of insect collected from the hilly site
In 2022, a total of 514 insect specimens were gathered from the hilly location. These specimens were classified into 17 species, 16 families, and 9 orders (refer to Table 4). These orders include species of different functional roles. Hymenoptera included 4 species, while Lepidoptera had 3 species. The lowest number of species was observed in Odonata, Orthoptera, and Thysanoptera, each represented by 1 species. Hymenoptera species are recognized as decomposers of organic matter, predators of other insects, and important components of food webs, serving as predators, pollinators, or both. Species of Lepidoptera have been observed to act as pollinators and serve as a food source for other insects. Natural enemies were designated to species that belong to Neuroptera and Odonata, while phytophagous or plant pest species are classified under Orthoptera and Thysanoptera, (Table 4).Hymenoptera species are prevalent in hilly site mainly due to the fact that elevation in this location frequently present advantageous environmental conditions, including favorable temperatures and more reliable food sources, which are conducive to their life history and thermoregulatory characteristics. Hymenoptera, particularly bees and ants, are highly suited to these environments because the hilly site can provide a variety of microhabitats, such as slopes and sheltered spots, that are perfect for nesting and foraging by Hymenopterans phytophagous species. Lepidoptera species are prevalent in hilly site due to the diverse elevations and intricate terrain that foster a variety of microclimates and habitats. This ecological diversity accommodates a broader spectrum of host plants for larvae and nectar sources for adults, thereby offering specialized niches for various species to flourish. Additionally, the rolling landscape can shield against wind, while simultaneously generating differing light and moisture conditions that meet the specific physiological requirements and life cycles of various Lepidoptera. Stuhldreher and Fartmann (2018) reported that among the factors that determine habitat quality for butterflies, an adequate microclimate is of crucial importance, especially for the less mobile immature stages. De Resende et (2021) examined Odonata diversity in Arizona, they showed that variations in the population of Odonata species are associated with insect behavior, particularly concerning territoriality in relation to feeding and reproductive patterns. Eggleton(2020) reviewed that insects are essential components of earth's ecosystems, fulfilling various roles that support environmental equilibrium and human existence. Their functions range from pollination to aiding in decomposition, enhancing soil health, facilitating nutrient cycling and promoting plant growth. Additionally, these organisms are connected to socio-economic, cultural, and public health domains. Given the imminent dangers posed by climate change, habitat destruction, and pollution, insects are confronted with significant challenges.
Table 4. Species composition of insects in the Hilly site| Order | Family | Scientific Name | Individual numbers | Functional Group | |
| Coleoptera | Tenebrionidae | Vieta dongolensis Castelnau | 4 | Decomposition of organic matter and nutrient recycling | |
| Scarabaeidae | Coprini klobe | 100 | Decomposition of organic matter and nutrient recycling | ||
| Diptera | Muscidae | Musca domestica | 18 | mechanical vector for various pathogens | |
| Tephritidae | Dacus longistylus | 100 | Plant fruit pest | ||
| Hemiptera | Aphididae | Aphid sp. | 8 | Plant pest | |
| Lygaeidae | Spilostethussp. | 23 | Plant pest | ||
| Hymenoptera | Apidae | Xylocopa sp. | 2 | pollinator | |
| Apis mellifera | 5 | pollinator | |||
| Formacidae | Camponotus sp. | 100 | wood decomposers, predators of other insects, and important components of food webs | ||
| Scoliidae | Campsomeriella thoracica | 6 | Predator (natural enemy) | ||
| Lepidoptera | Papilionidae | Papilio sp. | 8 | pollinator and a consumer of plants | |
| Pieridae | Catopsilia florella Fabricius | 8 | pollinator | ||
| Noctuidae | Unidentified | 6 | Pollinator and food source | ||
| Neuroptera | Myrmeleontidae | Gymnocnemia sp. | 8 | Predator (natural enemy) | |
| Odonata | Aeshnidae | Anaxephippiger | 100 | Predator (natural enemy) | |
| Orthoptera | Acrididae | Chrotogousspp. | 13 | Plant pest | |
| Thysanoptera | Thripidae | Thrip sp. | 5 | Plant pest | |
| Total | 9 | 16 | 17 | 514 |
Species dynamic of insect collected in 2022 from the hilly site
The dynamic and numerical variation observed in insect species gathered from the hilly site revealed that the highest individual counts were achieved by three species: Coprini klobe (dung beetle), Dacus longistylus (fruit fly), Camponotus sp. (carpenter ant), and Anax ephippiger (dragonfly), each reaching a total of 100 individuals (Figure 2).Silva et al (2020) indicated that the dynamic of dung beetles is affected by variations in habitats across various combined with anthropogenic factors such as fire and habitat fragmentation, that are significant factors accounting for the dung beetle species richness and distribution patterns.
Figure 2. Species dynamic of insects collected from the hilly site in 2022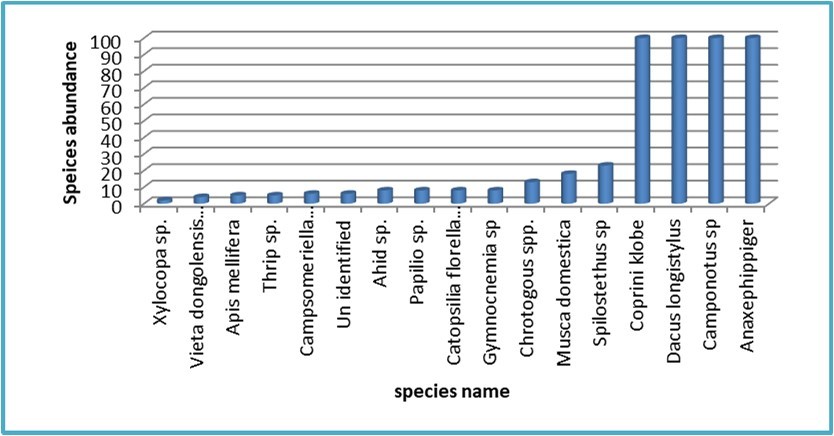
Download figure
Species composition and ecological role of insect collected from the flat site
In 2022, researchers collected 484 insect specimens from a flat site, which were classified into 15 species, 12 families, and 7 orders. The Lepidoptera order had the most species with 5, including 3 pollinators and 2 pests, while Odonata and Orthoptera each had just one species. The Odonata species are predators, and the Orthoptera species are plant pests. Studies revealed that Lepidoptera species thrive in environments that offer a variety of plants and resources, which provide nourishment for larvae, nectar for adults, and shelter, 5. These elements are all influenced by the characteristics of the habitat and the structure of the vegetation 6. Flat area that boast a rich assortment of native plants, along with features such as uncultivated patches, are more effective in supporting a high diversity of Lepidoptera compared to simple, uniform flat soil that lacks these components. Several factors contribute to the diversity of Lepidoptera in suitable habitats. Lepidoptera rely on specific host plants for their larvae (caterpillars) and nectar-producing flowers for adults. In flat area a complex array of plants fosters a greater diversity of species, particularly plant feeders and pollinators. This area can offer essential shelter, protection from extreme temperatures, and a stable environment for Lepidoptera 7.The interplay of biotic factors (plants and insects) and a biotic factors (temperature, humidity, soil quality) determine the suitability of a habitat for Lepidoptera. A high number of Lepidoptera species is not typically found in generic "flat soil" but rather in complex, resource-rich habitats that may encompass flat areas. The diversity of plants, availability of shelter, and stable conditions are essential drivers of Lepidoptera species richness. The low abundance of Odonata species in flat site could be due to unfavorable site characteristics where these insects depend on stable aquatic habitats throughout their larval stage. Flat soil typically does not provide these conditions due to inadequate drainage, resulting in desiccation and heightened competition. Furthermore, flat soil environments are linked to environmental stressors such as runoff and extreme temperatures, all of which further impede the survival of Odonata. Similar observations were given by Kaltsas et al (2025) who studied Odonata diversity in Greece. Table 5
Table 5. Species composition and ecological role of insect collected from the flat site| Order | Family | Scientific name | Individual numbers | Functional group |
|---|---|---|---|---|
| Coleoptera | Scarabaeidae | Catharsius sesostris | 9 | Improve soil fertility |
| Onthophagus nuba | 100 | Improve soil fertility | ||
| Diptera | Muscidae | Musca domestica | 12 | disease mechanical vector |
| Tephritidae | Dacus longistylus | 100 | Fruit pest | |
| Hemiptera | Pentatomidae | Chlorochroa sp. | 15 | Crop pest |
| Hymenoptera | Megachilidae | Megachile sp. | 3 | pollinator |
| Apidae | Apis mellifera L | 3 | pollinator | |
| Formacidae . | Camponotus sp | 100 | wood decomposers and generalist predators/scavengers | |
| Lepidoptera | Erebidae | Utetheisa pulchella (Linnaeus) | 3 | pollinator |
| Pieridae | Belenois aurota (Fabricius) | 9 | pollinator | |
| Catopsilia florella Fabricius | 6 | pollinator | ||
| Colotis ephyia Klug. | 7 | Plant pest | ||
| Noctuidae | Spodoptera sp. | 8 | Plant pest | |
| Odonata | Libellulidae | Pantala flavescens | 100 | predator |
| Orthoptera | Paplionidae | Colotis sp. | 9 | pollinator |
| Total | 12 | 15 | 484 |
Species dynamic of insect collected in 2022 from the flat site
The data on insect species collected from the flat site revealed notable patterns in both diversity and abundance. Among the recorded species, the highest individual counts, with 100 specimens each, were observed in four particular species: *Onthophagus nuba* (dung beetle), *Dacus longistylus* (fruit fly), *Camponotus sp.* (carpenter ant), and *Anax ephippiger* (dragonfly), as illustrated in Figure 3. According to Nodzi et al. (2025) and AlWahaibi et al (2024), the population dynamics of dung beetles or fruit flies are significantly influenced by land use system, host plant type along with human-induced factors such as habitat fragmentation. These elements play a crucial role in shaping species richness and distribution patterns for dung beetles and fruit fly. Véle and Horák (2019) who studied carpenter ant colonization in forest eco system reported that ant abundance dependes on habitat properties. Conversely, the species with the lowest observed numbers were Megachile sp. (bee), Apis mellifera L. (honey bee), and Utetheisa pulchella (crimson-speckled moth), each represented by only three individuals. The factors influencing the abundance of Megachile sp., Apis mellifera L., and Utetheisa pulchella include habitat availability and quality, food resources, pesticide exposure, diseases and parasites, and climate change. While Apis mellifera and other bee species like Megachile are affected by habitat loss and parasites, Utetheisa pulchella, as a moth species, is primarily affected by the availability of host plants for its larvae and climate conditions. Similar observation was shown by Post (2024) and Savela (2019).
Figure 3. Insect species dynamic in the flat site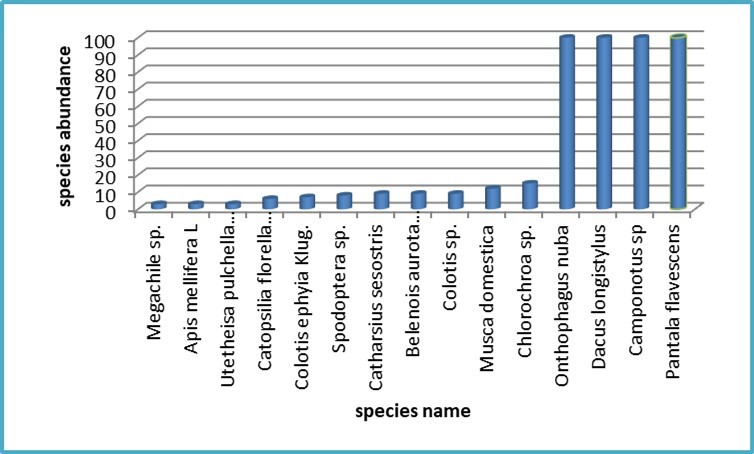
Download figure
Species composition and ecological role of insect collected from the valley site
The composition of species and the ecological roles of insects collected from the valley site in 2022 are evaluated. Table 6 indicted collection of 543 insect specimens were gathered by researchers from a flat site, which were categorized into 17 species, 16 families, and 9 orders. The order Hymenoptera exhibited the highest number of species, totaling 4, which included 2 pollinators, 1 wood decomposer, and 1 predator of other insects. Lepidoptera ranked second to Coleoptera in terms of species count, with 3 species, two of which serve as pollinators. The orders Neuroptera, Odonata, Orthoptera, and Thysanoptera each had the lowest species abundance, with 1 species identified as either a pollinator or a predator. Mansour and Imam (2017) conducted a study on the diversity of Coleoptera in a valley site in Egypt. Their findings revealed that this insect order is dominant, with species identified as natural enemies (including parasitoids and predators), organic decomposers, pollinators, and plant pests. These results indicate that such species play a significant role in nutrient cycling and other essential functions within the ecosystem.
Table 6. Species composition and ecological role of insect collected from the valley site| Order | Family | Scientific Name | Individual numbers | Functional group |
|---|---|---|---|---|
| Coleoptera | Tenebrionidae | Vieta dongolensis Castelnau | 18 | Decomposition of organic matter and nutrient recycling |
| Carabidae | Graphipterus obsoletus | 100 | Predator | |
| Diptera | Muscidae | Muscadomestica | 18 | Disease victor |
| Tephritidae | Dacus longistylus | 100 | Fruit pest | |
| Hemiptera | Aphididae | Ahid sp. | 6 | Pollinator |
| Lygaeidae | Spilostethussp | 21 | Plant pest | |
| Hymenoptera | Apidae | Xylocopa sp. | 2 | Pollinator |
| Apis mellifera | 2 | Pollinator | ||
| Formicidae | Camponotussp | 100 | wood decomposers, predators of other insects, and important components of food webs | |
| Scoliidae | Campsomeriella thoracica | 21 | Predator (natural enemy) | |
| Lepidoptera | Papilionidae | Papilio sp. | 10 | pollinator and a consumer of plants |
| Pieridae | Catopsiliaflorella Fabricius | 10 | Pollinator | |
| Noctuidae | Un identified | 7 | Unknown | |
| Neuroptera | Myrmeleontidae | Gymnocnemia sp | 8 | Predator (natural enemy) |
| Odonata | Aeshnidae | Anaxephippiger | 100 | Predator (natural enemy) |
| Orthoptera | Acrididae | Chrotogousspp. | 16 | Plant pest |
| Thysanoptera | Thripidae | Thrip sp. | 4 | Plant pest |
| 9 | 16 | 17 | 543 |
The lowest species abundance of Neuroptera, Odonata, Orthoptera, and Thysanoptera in the valley site could be due to inadequate habitat quality, which may include habitat fragmentation or insufficient vegetation diversity, severe abiotic conditions like low humidity, extreme temperatures, as well as human-induced disturbances, including pollution or the application of pesticides. In contrast, elements that enhance species abundance, such as adequate moisture, a rich diversity of vegetation, and complex microhabitats, are frequently present in other regions and may be lacking in the valley site.
The species dynamics of insects collected in 2022 from the valley site
The data shown in Figure 4 illustrated insect species revealed from the valley site with significant trends in both diversity and abundance. Among the species documented, the highest individual counts, totaling 100 specimens each, were noted in four specific species: Graphipterus obsoletus (ground beetle), Dacus longistylus (fruit fly), Camponotus sp. (carpenter ant), and Anax ephippiger* (dragonfly), as depicted in Figure 4. In contrast, the species with the lowest recorded numbers were Xylocopa sp. (carpenter bees) and Apis mellifera L. (honey bee), each represented by merely two individuals. Skalski et al (2011) formerly examined the distribution of ground beetle assemblages across an elevation gradient in East Carpathians. They reported that most of the variation in ground beetle species were attributed to habitat characteristics e.g. elevation and the presence of vegetation cover. Anson et al (2019) reported that factors influencing abundance of bee species e.g. Xylocopa sp. in valley soil encompass the availability of appropriate nesting materials, the presence of specific food sources and favorable microclimatic conditions such as temperature.
Figure 4. Species dynamic in the valley site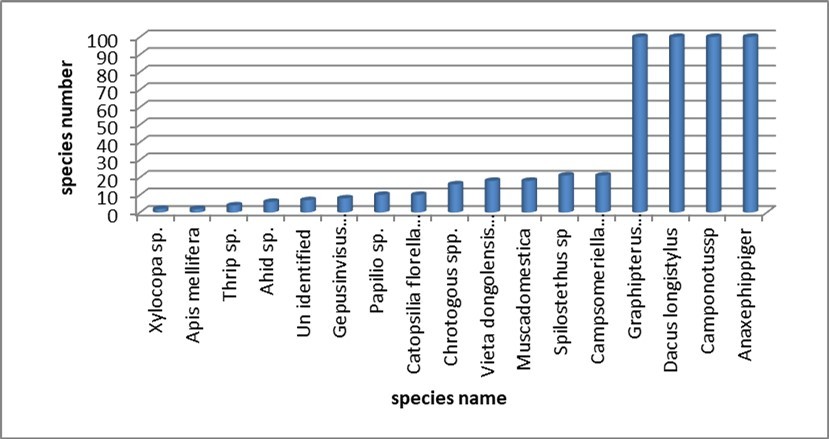
Download figure
Comparison of insect species composition and dynamic of between the three sites
Table 7 and Figure 5 present the findings from the evaluation of the species composition and dynamics of insects gathered from the three locations. It was evident that, at the order level, Coleoptera (35.65%) in the valley site surpassed those in the flat and hilly sites, which recorded 32.93% and 31.42%, respectively. Diptera exhibited equal abundance in both the valley and hilly sites (33.91% each), outpacing the flat site (32.18%). A greater relative abundance of Hemiptera was noted in the hilly site (42.47%) compared to the other two locations. Hymenoptera was recorded at 36.34% in the valley, which is higher than the figures for the hilly and flat sites (32.85% and 30.81%, respectively). Lepidoptera was documented at 40.24% in the valley, exceeding the counts in the flat and hilly sites (32.93% and 26.83%, respectively). Fifty percent of Neuroptera individuals were collected from both the valley and hilly sites, while this order was absent from the flat site. An equal relative abundance of Odonata was observed across the three sites (33.33%). Orthoptera was recorded at 42.11% in the valley site, followed by 34.21% and 23.68% in the hilly and flat sites, respectively. The flat site was devoid of Thysanoptera, which is restricted to the hilly site (55.56%) and the valley site (44.44%). Landelevation has an indirect impact on the abundance of insect orders by affecting habitat characteristics such as moisture, organic matter, and nutrient availability, which subsequently benefit particular insect guilds. For instance, the slopes and elevation gradients linked to habitat heterogeneity can generate unique microhabitats with differing conditions, resulting in variations in the distribution and abundance of orders like Coleoptera and Hymenoptera. Nevertheless, the specific connections between topographic features and insect orders are intricate and can differ considerably based on the larger ecosystem, which includes factors such as land use, vegetation cover, and seasonal climate variations. Different studies on insect diversity and variation in relation to habitat elevation correlated such fluctuations to habitat properties which favored life needs of food, reproduction and shelter of certain orders over others. Mhlanga et al (2022) examined the variation in ground insect diversity, composition, and abundance across land use types in an African savanna in Zimbabwe. They generalized that insect community dynamics were driven by the effect of land use on edaphic factors and season. Similar observations were formerly given by Mokamet al (2014) and later by Withaningsih et al (2025).
Table 7. Species composition and dynamic of insects collected from the three sites| Order | Study Site | ||||||
|---|---|---|---|---|---|---|---|
| Flat | Valley | Hilly | |||||
| Individual number | %/Total | Individual number | %/Total | Individual number | %/Total | Total | |
| Coleoptera | 109 | 32.93 | 118 | 35.65 | 104 | 31.42 | 331 |
| Diptera | 112 | 32.18 | 118 | 33.91 | 118 | 33.91 | 348 |
| Hemiptera | 15 | 20.54 | 27 | 36.99 | 31 | 42.47 | 73 |
| Hymenoptera | 106 | 30.81 | 125 | 36.34 | 113 | 32.85 | 344 |
| Lepidoptera | 33 | 40.24 | 27 | 32.93 | 22 | 26.83 | 82 |
| Neuroptera | 0 | 0 | 8 | 50.0 | 8 | 50.0 | 16 |
| Odonata | 100 | 33.33 | 100 | 33.33 | 100 | 33.33 | 300 |
| Orthoptera | 9 | 23.68 | 16 | 42.11 | 13 | 34.21 | 38 |
| Thysanoptera | 0 | 0 | 4 | 44.44 | 5 | 55.56 | 9 |
| Total | 484 | 543 | 514 | 1539 | |||
Figure 5. Insect abundance based on the total counts of sampled orders from the three elevated sites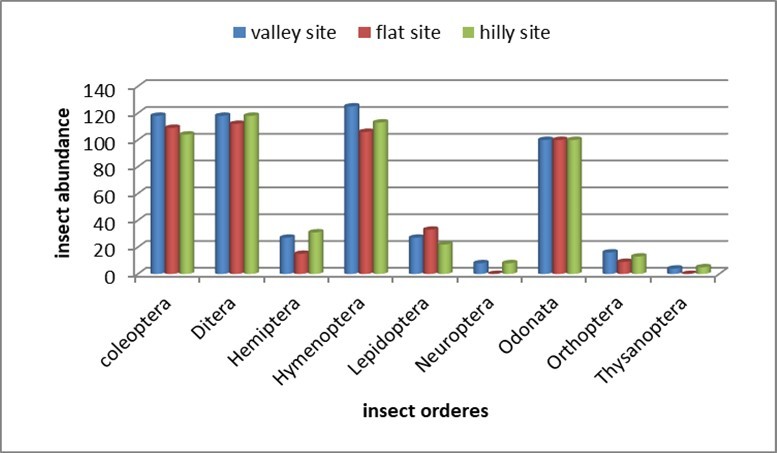
Download figure
The absence of Neuroptera and Thysanoptera from the flat site could be due to the lack of a suitable food source, e.g., a prey host for Neuroptera and a plant pest for Thysanoptera, at the time of collection. Bozdoğan (2020) indicated that environmental and habitat variables, e.g., wind speed and temperature, accounted for species distribution patterns in Neuroptera. Barbosa et al (2019) reported that the population density of Thysanoptera depends on the phenological stage of the plant, climatic conditions, and populations of natural enemies
Biodiversity indices between sites
The insect populations across the three research sites exhibited slightly varying levels of diversity as indicated by the Simpson's Diversity Index (Table 8). The valley site showed the highest diversity level with an index score of 0.857, followed by the flat site at 0.826, and the hilly site at 0.819. This notably high level of insect diversity indicates the most significant diversity among the three sites, reflecting a rich and complex insect community characterized by a considerable number of species and a relatively even distribution of individuals among them. Elevated values, generally approaching 1, signify greater species richness and evenness, which enhance the stability and resilience of the ecosystem. The high Simpson's diversity in insects is attributed to their extensive variety of species and diverse habitats 8. The Shannon diversity index was calculated for insects obtained from the three study sites. The results in table (8) explain that the valley study site, with a Shannon diversity index of 2.22, showed the highest diversity among the three sites, surpassing the flat site (2.068) and the hilly site (2.003). This indicates a relatively diverse insect community at the valley site, characterized by a greater number of species and a more even distribution of individuals across those species. Farooq et al (2021) reported that a higher value of Shannon diversity index indicates a more diverse community. This observation can likely be attributed to the fact that diversity tends to increase when habitat disturbances occur at an intermediate level, meaning neither too infrequently nor too frequently. Diversity reaches its peak at this intermediate level because species that are adapted to various succession stages can coexist within the same habitat. Conversely, species richness diminishes at low disturbance levels due to the rise of competitive exclusion. It appears probable that an ecosystem with a more abundant insect population is healthier compared to one to a lower population.
Table 8. Diversity indices of insects collected from the three study sites| Diversity Index | Hilly site | Flat site | Valley site |
| Simpson’s Diversity Index(1- D): | 0.819 | 0.826 | 0.857 |
| Shannon diversity index | 2.068 | 2.003 | 2.22 |
| Dominance Index % | 33.35 | 31.41 | 35.24 |
| Margalef Richness Index | 2.5632 | 2.2646 | 2.54 |
| Evenness | 00.73 | 00.74 | 0.78 |
| Richness (number of species) | 17 | 15 | 17 |
| Total number of individuals | 514 | 484 | 543 |
| Average population size | 57.11 | 60.50 | 60.33 |
Examining the relative abundance of insects obtained from the three sites explained that the relative dominance in the valley site is 35.24%, followed by the hilly site at 33.35% and the flat site at 31.41% (Table 8). Collins et al. (2024) referenced literature concerning insect ecology and conservation at the individual, species, and/or community levels, which includes the impacts of habitat quality, quantity, and land use type on insect diversity; the effects of anthropogenic pollution (including heat, noise, light, and chemicals); habitat connectivity and changes in habitat structure, as well as the influence of habitat density on genetic diversity. They found that insect diversity and dominance are influenced by habitat fragmentation and environmental factors. Additionally, the variability in responses among different insect orders or across various sites, combined with the methodological limitations of individual studies, makes it challenging to discern overarching patterns. The Margalef Richness Index, calculated for insects collected from the three locations, indicates a moderate level of richness, with values of 2.5632 in the hilly site, 2.54 in the valley site, and 2.2646 in the flat site, (Table 8). The observed results may stem from the capacity of each site to supply essential resources for insects. Joseph and Balakrishnan (2005) noted that the variety of insects in a given area is largely influenced by the accessibility of food resources. Insect populations at these locations were moderately influenced by habitat heterogeneity, a significant factor that contributes to species richness. The diversity and prevalence of insect species within an ecosystem are intricately linked to the physical stability of the habitat, which is necessary for supporting insect feeding and reproduction.
Insects species distribution in the three study sites
The distribution of insect species were analyzed across the three study sites, with the findings presented in Table 9 and Figure 6 below. It is clear that certain insects collected were present in some sites but absent in others. Table 9 indicates that Aphid sp., Anax ephippiger, Papilio sp., Spilostethus sp., Thrip sp., unidentified species, Vieta dongolensis, and Xylocopa sp. were observed in both hilly and valley sites, but not in the flat site. Conversely, Belenois aurota, Megachile sp., Onthophagus nuba, Pantala flavescens, Spodoptera sp., and Utetheisa pulchella were identified in the flat site, yet were not found in the hilly and valley sites. Similarly, Campsomeriella thoracica and Gymnocnemia sp. were present in the hilly and valley sites but absent from the flat site, while Graphipterus obsoletus was found in the valley but not in the hilly or flat sites. The variations of insect species presence or absence and distribution between sites is influenced by different ecological factors such as the availability and suitability of habitat, such as particular food sources, shelter, and nesting sites, variations in climatic conditions including temperature and precipitation that affect a species potential for survival and reproduction. Furthermore, the introduction of invasive species, habitat fragmentation can significantly decrease variety in some places while opening up new opportunities for others, Leather (2017)
Table 9. Species composition and relative abundance in the three sites| Insect Species | Hilly site | Flat site | Valley site |
|---|---|---|---|
| Aphid sp. | 8 | 0 | 6 |
| Anax ephippiger | 100 | 0 | 100 |
| Apis mellifera | 5 | 3 | 2 |
| Belenois aurota | 0 | 9 | 0 |
| Camponotus sp. | 100 | 100 | 100 |
| Campsomeriella thoracica | 6 | 0 | 21 |
| Catopsilia florella | 8 | 6 | 10 |
| Chrotogous spp. | 13 | 15 | 16 |
| Coprini klobe | 100 | 0 | 0 |
| Dacus longistylus | 100 | 100 | 100 |
| Gymnocnemia sp. | 8 | 0 | 8 |
| Graphipterus obsoletus | 0 | 0 | 100 |
| Megachile sp. | 0 | 3 | 0 |
| Musca domestica | 18 | 12 | 18 |
| Onthophagus nuba | 0 | 100 | 0 |
| Papilio sp. | 8 | 0 | 10 |
| Pantalaflavescens | 0 | 100 | 0 |
| Spilostethus sp. | 23 | 0 | 21 |
| Spodoptera sp. | 0 | 8 | 0 |
| Thrip sp. | 5 | 0 | 4 |
| Unidentified | 6 | 0 | 7 |
| Utetheisa pulchella | 0 | 3 | 0 |
| Vieta dongolensis | 4 | 0 | 18 |
| Xylocopa sp. | 2 | 0 | 2 |
Figure 6. Species dynamic in the three study sites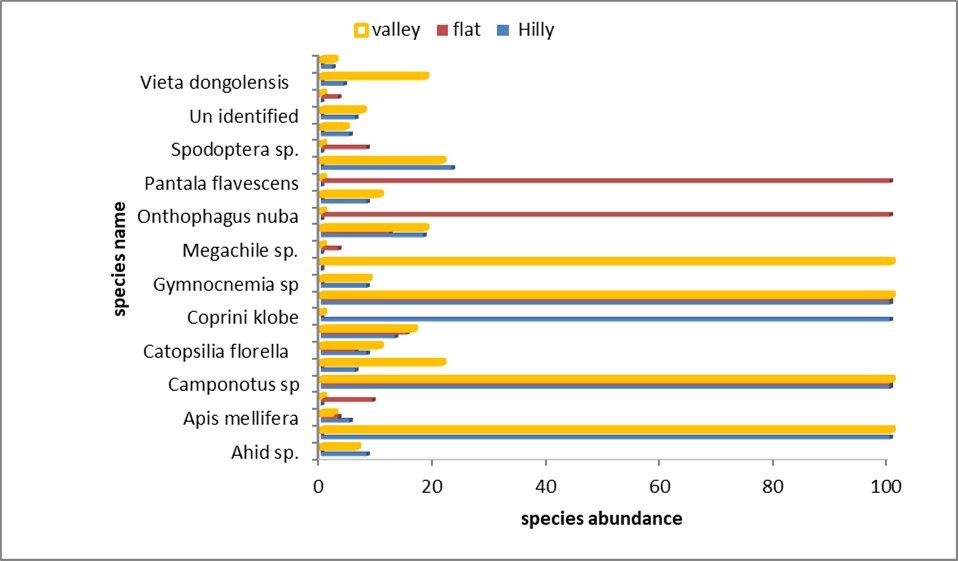
Download figure
Overall comparison between the three sites
Insects collected from the three study site was analyzed using PERMANOVA, or permutational multivariate analysis of variance and the obtained results are given in Table 10. These findings revealed notable variations among the three sites (F = 2.24, p-value = 0.035), which represent roughly 2.74% of the variance in species composition across the sites (R² = 0.427). This outcome suggests that the composition and distribution of insect communities vary between the areas examined. These variations may arise from habitat heterogeneity, which is more conducive to certain groups of insects than to others. Shakeel et al. (2022) asserted that, alongside other climatic factors, habitat heterogeneity serves as a significant driver of faunal biodiversity.
Table 10. PERMANOVA: Comparing Insect Communities from Three sites| Df | Sum of Sqs. | R2 | F | P-value | |
| Model | 2 | 1.1531 | 0.42749 | 2.2401 | 0.035 * |
| Residual | 6 | 1.5443 | 0.57251 | ||
| Total | 8 | 2.6975 | 1.00000 |
References
- 1.Mansowr Z F. (2025) Importance of Insects in the Ecosystem: A Review. Available at: https://www.pubtexto.com/journals/journal-of-food-technology-and-preservation/fulltext/importance-of-insects-in-the-ecosystem-a-review.
- 2.M A Abdellatif, A M. (2025) Impact of the Sudan War on Biodiversity, presented online in rebuilding Sudan after the war international conference (4) organized by the World Association of Sustainable Development (WASD) and Sudan knowledge forum. https://conferences.wasd.org.uk/listing/re-building-sudan-after-the-war-4/
- 3.Wijerathna T, Gunathilaka N. (2020) Morphological identification keys for adults of sand flies (Diptera: Psychodidae). in Sri Lanka. Parasites Vectors 13 450.
- 4.Stefanidis A, Kougioumoutzis K, Zografou K, Fotiadis G, Willemse L et al. (2025) . Distribution Patterns and Habitat Preferences of Five Globally Threatened and Endemic Montane Orthoptera (Parnassiana and Oropodisma). Ecologies 6(1), 10-3390.
- 5.R J Forbes, S J Watson, O’Connor E, Wescott W, M J Steinbauer. (2019) Diversity and abundance of Lepidoptera and Coleoptera in multiple-species reforestation plantings to offset emissions of carbon dioxide. , Australian Forestry 82(2), 89-106.
- 6.Legal L. (2023) Lepidoptera Flies”, but Not Always…Interactions of Caterpillars and Chrysalis with Soil. , Diversity 15(1), 27-10.
- 7.Alison Jamie, Simon J Duffield, Michael D Morecroft, Rob H Marrs, Jenny A Hodgson. (2017) Successful restoration of moth abundance and species-richness in grassland created under agri-environment schemes. Biological Conservation,213(A):. 51-58.
- 8.S M Ada, T R, Omudu. (2018) Diversity and Abundance of Insects Species in Makurdi. , Benue State, Nigeria, Economics of Innovation and New Technology 4(6), 52-57.
- 9.Aina-oduntan oa, Onilude qa, George-Onaho Ja, Woghiren Ai, Jeminiwa. (2021) Spatial Distribution of Insect Diversity in Selected Locations within Forestry ResearchInstitute of. DOI: https://dx.doi.org/10.4314/jasem.v25i7.21 , Nigeria, Ibadan, Nigeria, Journal of Applied Sciences and Environmental management 25(7), 1249-1255.
- 10.Ali K AlWahaibi, Sara M AlAnsari. (2024) Fruit Flies Fauna, Bio-ecology, Economic Importance andManagement with an Overview of the Current State of Knowledge. in the Sultanate of Oman and theArabian Peninsula, Article 5 "Journal of Agricultural and Marine Sciences: at: https://jams.squ.edu.om/home/vol29/iss1/5 29, 15-55.
- 12.Breno Gomes Barbosa, Renato Almeida Sarmento. (2019) Poliana Silvestre Pereira, Cleovan Barbosa Pinto, Carlos Henrique de Oliveira Lima, Tarcísio Visintin da Silva Galdino, Abraão Almeida Santos, and Marcelo Coutinho Picanço. 102(1), 10-15.
- 13.Bozdoğan H. (2020) species richness and composition of Neuroptera in the forests fregments of the Taurus Mountains Range, Turkey. Available at: https://doi.org/10.1016/j.sjbs.2020.02.018 , Saudi Journal of Biological Sciences 27(5), 1201-1207.
- 14.Sinu N, Saunders P, M. (2024) Insect ecology and conservation in urban areas: An overview of knowledge and needs. Insect conservation and diversity,17(2): Pages 169-181. Available at :. https://doi.org/10.1111/icad.12733
- 15.Resende B O de, Ferreira V R S, L S Brasil. (2021) Impact of environmental changes on the behavioral diversity of the Odonata (Insecta) in the Amazon. Sci Rep11. 9742-10.
- 16.N T Dianzinga, Moutoussamy M, Sadeyen. (2020) The interacting effect of habitat amount, habitat diversity and fragmentation on insect diversity along elevational gradients. , Journal of Biogeography 47(11), 2377-2391.
- 17.Eggleton P. (2020) The state of the world's insects. , Annual Review of Environment andResources 45, 61-82.
- 18.M Li Farooq, Tan X, L. (2021) Ephemeroptera (Mayflies) Assemblages and Environmental Variation along Three Streams Located in the Dry-Hot Valleys of Baima Snow Mountain, Yunnan, Southwest China. , Insects 12(9), 775-10.
- 19.Field-level characteristics influence wild bee functional guilds on public lands managed for conservation. Global Ecology and Conservation,17: e00598. Available at: https://doi.org/10.1016/j.gecco.2019.e00598 .
- 20.A C, Balakrishnan M. (2005) . Abundance and Richness of Insects in Kazhakuttom Grama Panchayat in Kerala. Bulletin of the National Institute of Ecology 16: 19-27.
- 21.Kaltsas D, Alvanou L, Ekklisiarchos I, D I Raptis, D N Avtzis. (2025) . Canopy Cover Drives Odonata Diversity and Conservation Prioritization in the Protected Wetland Complex of Thermaikos Gulf (Greece). Forests 16(7), 1181-10.
- 22.Rao A, V, Madhavi M. (2024) . Studies on Relative Abundance and Diversity of Insect Fauna in Cotton in , Rajendranagar, Telangana, India, Journal of Scientific Research and Reports 30(9), 457-463.
- 23.Leather S. (2017) Ecological Armageddon' – more evidence for the drastic decline in insect numbers". , Annals of Applied Biology 172, 10-1111.
- 24.N A, Imam. (2017) Spatial distribution of Hymenoptera under the rain-fedconditions of Habis valley. Available at : http://www.innspub.net , Northwestern Coast, Matrouh Governorate, Egypt.Journal of Biodiversity and Environmental Sciences 11(1), 25-35.
- 25.C D, J E Carvajal-Cogollo. (2022) Effects of habitat loss on three insect assemblages in modified ecosystems of foothills of the Colombian Orinoquia. , Terrestrial ecology 70, 504-525.
- 26.Mhlanga L, C ithole Kapembeza, R, Kativu Sh. (2022) Variation in ground insect diversity, composition and abundance across land use types in an African savanna, Zimbabwe. Scientific African,(16) e01204. Available at:https://doi.org/10.1016/j.sciaf.2022.e01204.
- 27.Mokam D G, Djiéto-Lordon C, Bilong. (2014) Patterns of species richness and diversity of insects associated with cucurbit fruits in the southern part of Cameroon. , Journal of insect Science 1, 25525110-5657925.
- 28.Nodzi H, Gohole L, Mapaure I. (2025) Comparison of species diversity, richness, and abundance of dung beetles between wildlife and wildlife-livestock systems. in north-eastern Namibia. International journal of tropical insect science 1-14.
- 29.Post K. (2024) Factors Affecting Honey Bee (Apis mellifera L.) Health as Perceived by South GeorgiaCommercial Beekeepers. , The Journal of Extension 61(3), 10-34068.
- 30.Savela Markku. (2019) Utetheisa pulchella (Linnaeus, 1758)". Lepidoptera and Some Other Life Forms. Available at: https://en.wikipedia.org/.
- 31.Dhaheri Al, Sh. (2022) Does habitat heterogeneity influence taxonomic richness and abundance? A case study from a terrestrial protected area in Abu Dhabi, United Arab Emirates. Available at: https://doi.org/10.1016/j.sjbs.2021.10.056 , Saudi Journal of Biological Sciences 29(3), 1737-1746.
- 32.Silva J L, Silva R J, Fernandes I M, Sousa W O, Vaz-de-Mello F Z. (2020) Species composition and community structure of dung beetles (Coleoptera: Scarabaeidae: Scarabaeinae) compared among savanna and forest formations in the southwestern Brazilian Cerrado. , Zoologia 37, 1-12.
- 33.Kędzior T, Maciejowski R. (2011) Soil and habitat preferences of ground beetles (Coleoptera,Carabidae) in natural mountain landscape. Available at : https://bjc.sggw.edu.pl/ , Baltic Journal of Coleopterology 11(2), 105-115.
- 34.Stuhldreher G, Fartmann. (2018) Threatened grassland butterflies as indicators of microclimatic niches along an elevational gradient – Implications for conservation in times of climate change. , Ecological 94(1), 83-98.
- 35.Xing X, Zhao Y, Liu J, He Y, Lin Z et al. (2025) Climatic seasonality shapes insect community composition on the Mongolian Plateau. Ecological indicators,175: 113595. Available at: www.elsevier.com/locate/ecolind.
- 36.Tuhin M I A, Nasiruddin M, Nayem Z. Different Areas of Chittagong University Campus, Bangladesh (2023) Diversity and Relative Abundance of Entomofauna of Four Ecologically. , American Journal of Life Science and Innovation 2(2), 1-11.
- 37.Véle A, Horák J. (2019) Space, Habitat and Isolation are the Key Determinants of Tree Colonization by the Carpenter Ant in Plantation Forests. , Forests 10(8), 630-10.
- 38.Withaningsih S, B F Ilmi, Parikesit P. (2025) Correlation Between Flying Insect Diversity and Environmental Factors in Various Land Use Types in Paseh District, Sumedang Regency. , West Java. Diversity 17(1), 10-3390.
- 39.I H Abdellatif, A M, Ali Abu. (2014) Diversity of arthropods in Hafier Doka reserve forest. Sudan. European Environmental Sciences and Ecology Journal,1(2): Available at:https://elpjournal.eu/wp-content/ 51-67.
- 40.M A Abdellatif, M. Publisher: St. Kliment Ohridski University Publishing(2015).Combating Desertification in Sudan: in: Environment and Ecology at the Beginning of the 21stCentury. Recep Efe. , Sofia, Bulgaria, Carmen Bizzarri, İsa Cürebaland Gulnara N. Nyusupova, (Eds.) ISBN 978-954.
- 41.Ghani A, Maalik S. (2020) Assessment of diversity and relative abundance of insect fauna associated with Triticum aestivum from district Sialkot, Pakistan.Journal of King Saud university-science. 32(1), 986-995.
- 42.A, Bilal N A A. (2012) The major predators associated with Lucerne crop at El-gorair Scheme. in Northern Sudan.International Journal of Science Innovations and Discoveries 2(6), 567-572.
- 43.Zookeys. (2019) A catalogue of the tribe Sepidiini Eschscholtz, 1829 (Tenebrionidae, Pimeliinae) of the world. In: Kamiński. A catalogue of the tribe Sepidiini Eschscholtz, 1829 (Tenebrionidae, Pimeliinae) of the world. Zookeys. 2019; 844: 1-121. doi: 10.3897/zookeys.844.34241. PMID: 31143077; PMCID: PMC6527536 .