
Abstract
This work characterizes the transmission dynamics of the cases registered by Covid-19 in Venezuela. The needed input data were obtained from the official gazettes issued by the Government of Venezuela, from March 15 to September 9, 2020. Later, the value of the mantissa was determined, revealing the impact of the different outbreaks with special attention to the events at the baseball stadium in Nueva Esparta State, and the Las Pulgas Market located in Maracaibo. Finally, a mathematical model based on four epidemic waves revealed that the cases are increasing significantly over time after the episode that occurred in the Las Pulgas Market.
Author Contributions
Academic Editor: Jose Luis Turabian, University of Madrid, Toledo, Spain.
Checked for plagiarism: Yes
Review by: Single-blind
Copyright © 2020 Raúl Isea
 This is an open-access article distributed under the terms of the Creative Commons Attribution License, which permits unrestricted use, distribution, and reproduction in any medium, provided the original author and source are credited.
Competing interests
The authors have declared that no competing interests exist.
Citation:
Introduction
The world is facing a pandemic caused by a new coronavirus (SARS-CoV-2) that has generated more than twenty-seven million infected people and eight hundred thousand deaths distributed in more than 180 countries, according to the Johns Hopkins University until September 9, 2020.
The scientific community is continuously working in models to predict the dynamics of contagion by Covid-19 1, 2, 3, 4, and thus it is possible to design and improve public health policies that allow counteracting the advancement of this disease.
The present work presents two different analyses carried out with the records of infections by Covid-19 in Venezuela. The first consists of calculating the Mantissa from the accumulated cases in the country this methodology has been explained in 5 and 5, 6, and finally a model based on the superposition of epidemic waves that will allow understanding the impact caused by them 7, 8.
The first cases that occurred in Venezuela were at the beginning of March 2020, as a result of an international flight from Europe. After that, the contagion rate was "low" due to the quarantine measures adopted in the country, and they were caused basically by imported cases. However, this panorama changed in mid-April in Nueva Esparta State, as a result of a quarantine violation in a professional baseball stadium. Later in May, another upturn in cases was registered in the Las Pulgas Market (Maracaibo). Finally, the numbers of contagions once again increased another order of magnitude, as a result of the upturns that are basically affecting the central region, that is, the states of Miranda and the Capital District.
Methodology
The Johns Hopkins University broadcasts a daily record of cases occurring in different countries in the world. However, this information is global, that is, without distinguishing those caused by community transmission or due to imported cases. In view of this, a manual survey of the information was carried out according to the data obtained in the official gazettes of the country, from March 15 to September 9 where the origin of the contagion was considered.
From the previous record, the value of the Mantissa was determined according to the methodology proposed by Isea 5, 6, which allows visualizing the rhythm of the "infection rate" as a function of time (this last comment will be discussed better in the Results section).
After visual inspection of the registered cases, a model based on the superposition of epidemic waves was calculated. This model can reproduce the total number of accumulated cases in the country, based on the following equation:

where all the cases (represented as "Infected") are the result of the superposition of n epidemic waves, where each one of them (from i = 1 to n) has its own amplitude (Ai) and extension according to the value of σi, centered at position xi. In this first study, the number of waves (n) was defined manually. Therefore, it only remains to determine the parameters of the model from a least squares adjustment according to the cases registered daily, using a program implemented in Python, whose procedure has been validated in previous publications (see for example 9, 10, 11, 12).
Results
(Figure 1) shows the result obtained from the total number of cases registered by Covid-19 in Venezuela (black) from March 15 to September 9. This graph reveals that the cases of contagion by Covid-19 began to increase significantly as of May 20. On the other hand, the result of the calculation of the mantissa is shown in orange, which allows visualizing the contagion rate of accumulated cases in the country.
Figure 1.Representation of cases infected by Covid-19 in black, while the result of the Mantissa calculation is shown in orange (see details in the text)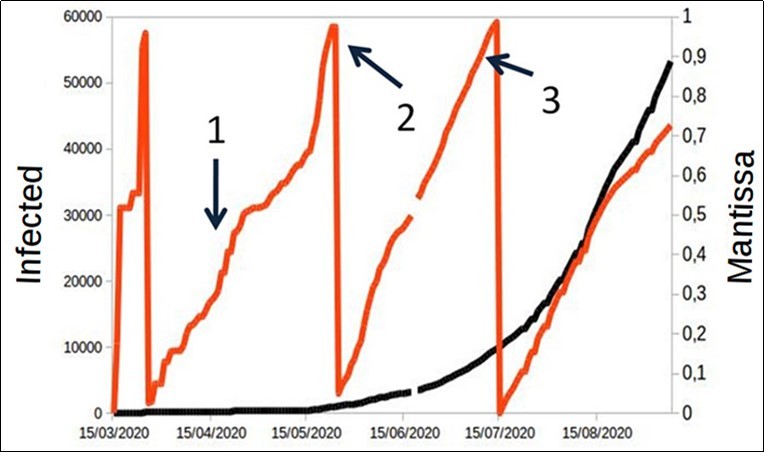
In this sense, it is interesting to note that the incident that occurred in the baseball stadium (indicated with the number 1) increased the contagion rate without generating a significant rebound. Unlike, the following event that occurred in the Las Pulgas Market in Maracaibo (indicated with number 2) was "responsible for triggering" the upturn in cases in the country to the point that it changed the rate of contagion and restarting it. It is noteworthy that once again the Mantissa curve changes drastically (represented by the number 3), with the sustained increase in cases that occurred in the central region of the country (mainly in the Capital District and Miranda).
(Figure 2) shows the distribution of community cases (blue color) and imported (orange) in Venezuela, from May 9 to September 9. The graph reveals that the communicative cases surpassed the imported ones after the second week of June, just after the incident of the Las Pulgas Market in Maracaibo State, this is, such an event was a "turning point" that triggered the number of infections in the country.
Figure 2.Daily record of infections by Covid-19 in Venezuela, where imported cases are recorded in orange, while community cases in blue
Finally, Figure 3 shows the result of modeling four epidemic waves to describe the community cases registered in the country, from May 9 to September 9 due to significant cases began after that date. Each wave is displayed with a solid line of a different color, while the recorded cases are displayed with a purple circle. The model parameters are indicated in Table 1, after least squares adjustment with the data. Such a graph shows how each epidemic wave increases over time until the third wave (green), but the fourth wave (red-colored, the result of the superposition of all of them) is beginning to increase just after the first week of September, after the rebound that occurred mainly in the central region of the country.
Figure 3.The dynamics of infections by Covid-19 is represented based on a model of four epidemic waves (solid lines), while the cases registered in Venezuela are visualized with a purple circle. The fourth wave (red in color) is the superposition of all the previous waves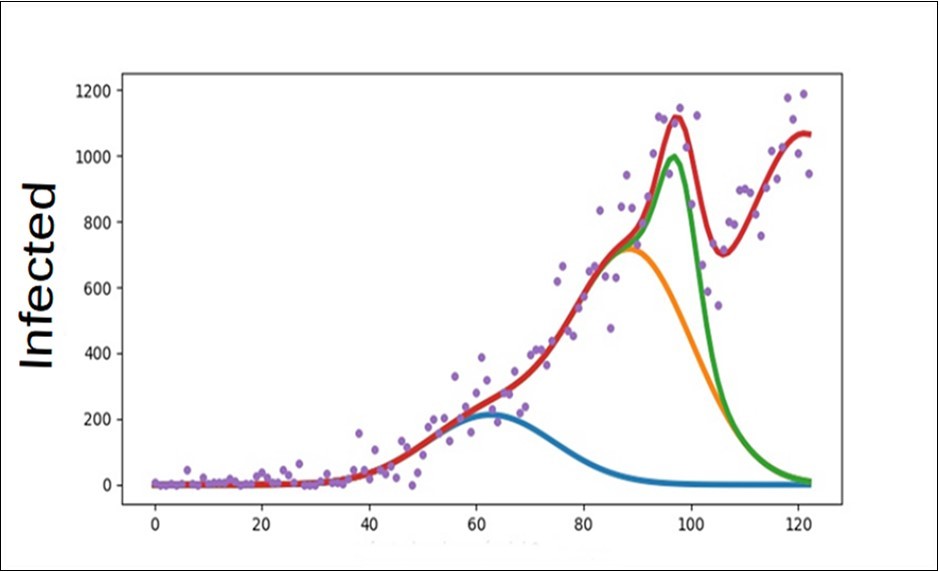

Conclusions
The work proposes a computational methodology that allows interpreting the dynamics of infections by Covid-19 in Venezuela, where it is appreciated how community cases began to predominate in the country after the episode of the Las Pulgas Market (Maracaibo), and not from the incident at the baseball stadium in Nueva Esparta. Likewise, the model based on epidemic waves revealed that each (re)outbreak increases the number of infections in the country. Thus, any other rebound after September 9 (similar to the one that occurred in Maracaibo) could generate negative effects in the very short term, so it is necessary to design measures that manage to contain the cases that occurred in the capital region and in the dormitory cities that border with the Capital District.
Acknowledgment
I’d like to acknowledgment to Rafael Mayo-Garcia for your comments in this manuscript.
References
- 1.Isea R. (2020) La dinámica de transmisión del Covid-2019 desde una perspectiva matemática. , Revista ObservadordelConocimiento 5(1), 15.
- 2.Isea R. (2020) A preliminary model to describe the transmission dynamics of Covid-19 between two neighboring cities or countries. MedRxiv ID:. 20156695.
- 3.Stutt R O, Retkute R, Bradley M, Gilligan C A, Colvin y et al. (2020) A modelling framework to assess the likely effectiveness of facemasks. in combination with “lock-down” in managing the Covid-19 pandemic. Proc.R.Soc. Vol. A476, ID: 20200376.
- 4.Kissler A J, Tedijanto C, Goldstein E, Grad Y H, Lipsitch y et al. (2020) Projecting the transmission dynamics of SARS-CoV-2 through the postpandemic period. , Science 368, 860.
- 5.Isea R. (2020) A new graph to display the epidemic outbreaks of Covid-19 in the World. , International Journal of Coronavirus 1(4), 1.
- 6.Isea R, Longreen y, KE. (2020) A quick look at the registered cases of Covid-19 throughout the world. , International Journal of Coronavirus 1(3), 15.
- 7.F de Castro. (2020) Modelling of the second (and subsequent) waves of the coronavirus epidemic.Spain and Germany as case studies. MedRxiv ID:. 20129429.
- 8.Nonio Juniorm AD, Silva da, Dal-Pizzol B A, y Porto F, LM. (2020) A two-wave epidemiological model of Covid-19 outbreaks using MS-Excel.MedRxiv ID:. 20095133.
- 9.Isea R. (2020) Analysis of an SEIR-SEI four-strain epidemic dengue model with primary and secondary infections.Revista Electrónica Conocimiento Libre y Licenciamiento. , Vol 7(5), 3.
- 10.Isea R y Lonngren, KE. (2018) Toward an early warning system for Dengue. , Malaria and Zika in Venezuela.Acta Scientific Microbiology 1(3), 30.
Cited by (2)
- 1.Isea Raúl, Turabian Jose Luis, 2021, Analytical Solutions of the Transmissibility of the SARS-CoV-2 in Three Interactive Populations, International Journal of Coronaviruses, 2(4), 1, 10.14302/issn.2692-1537.ijcv-21-3732
- 2.Isea Raúl, 2022, What Could Represent the Mantissa of the Registered Covid-19 Cases?, International Journal of Coronaviruses, 4(2), 1, 10.14302/issn.2692-1537.ijcv-22-4108